Customer Cohort Analysis: How to Evaluate Retention and Repeat Purchases
Sometimes the overall statistics look quite convincing: the customer base is growing, orders are coming in, and revenue is not declining. Yet a very different story may be unfolding underneath. For example, customers acquired in spring may continue to buy, while those acquired in summer hardly ever return after their first order. On average, everything still looks “normal.” But the problem is already there.
This is exactly the kind of difference that customer cohort analysis helps reveal. Rather than showing only the behavior of the entire customer base, it demonstrates how individual groups of buyers change over time.
What Is Cohort Analysis?
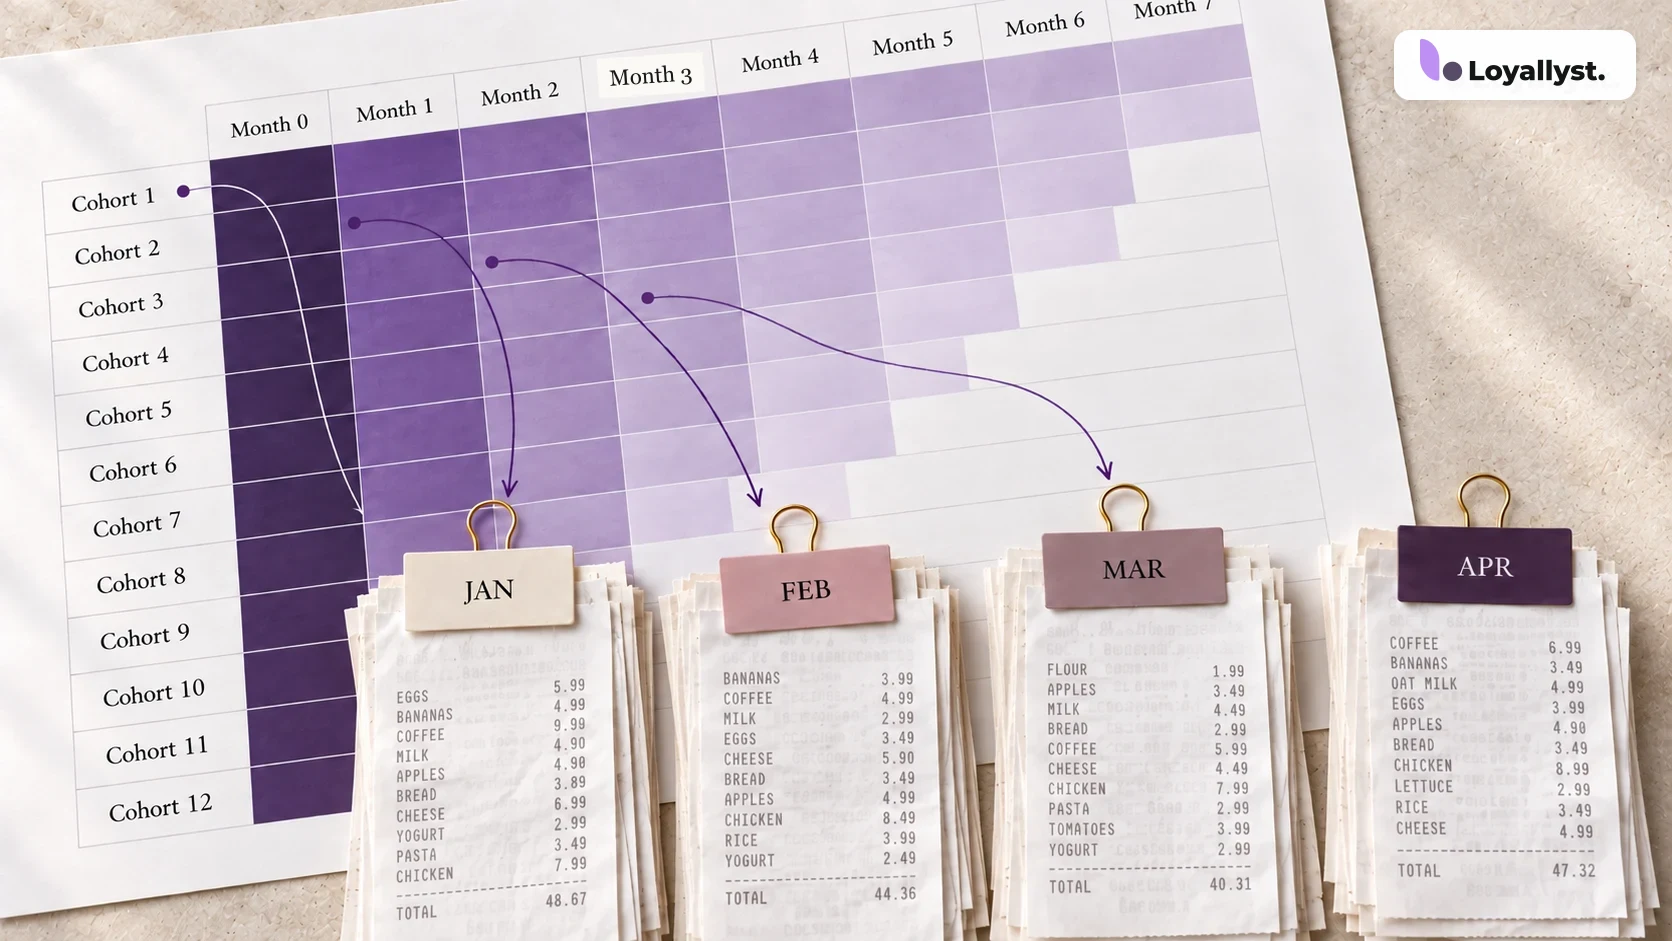
A cohort is a group of customers connected by a shared event and a specific period. Most often, that event is their first purchase. Suppose 300 people placed their first order in January. That is the January cohort. Another 420 new customers appeared in February, forming a different group. You can then see what share of January buyers returned after one month, two months, or six months and compare the result with the February cohort.
In short, cohort analysis is a way to track the behavior of similar customer groups over time. It is especially useful when a business needs to understand:
- whether new buyers return;
- how long it takes them to place a repeat order;
- which advertising campaign brought in more loyal customers;
- whether retention changed after launching a loyalty program;
- which promotions cause a short-term sales spike but have little effect on repeat purchases.
This is why businesses often conduct retention cohort analysis and sales cohort analysis separately.

How Does Cohort Analysis Differ From Segmentation?
These two approaches are easy to confuse. Both divide the customer base into groups, but they do so for different purposes.
Segmentation answers the question: what kinds of customers do we have right now? For example, you can identify regular buyers, customers with a high average order value, people who have not returned for a long time, or those interested in a particular jewelry category.
Cohort analysis answers a different question: how did a group’s behavior change after a specific event? Suppose two customers both belong to the “loyal” segment today. One first bought from you two years ago, while the other made their first purchase three months ago. That difference may not matter much for segmentation, but it is fundamental to cohort analysis. An easy way to remember it is this: a segment describes a customer, while a cohort helps track their journey over time.
How Do You Conduct Cohort Analysis?
It is best to start with one clear event. Do not try to analyze everything at once.
For repeat sales, businesses usually use the date of the first purchase. Then follow these steps:
- Choose a period, such as the past 12 months.
- Divide new customers by the month of their first purchase.
- For each cohort, calculate how many customers returned after 1, 2, 3 months, and beyond.
- Convert the number of returning customers into percentages.
- Compare the cohorts with one another.
28 / 100 × 100% = 28%
After two months, 21 customers remained active, so the rate would be 21%.
Cohort Analysis: A Jewelry Store Example
Imagine a jewelry store that wants to understand whether its new loyalty program affected repeat sales. In January, the program still operated under the old rules. In February, new buyers began receiving welcome points, followed several weeks later by reminders about their accumulated balance. The resulting matrix looks like this:
| Cohort | New customers | After 1 month | After 2 months | After 3 months |
|---|---|---|---|---|
| January | 200 | 22% | 15% | 11% |
| February | 240 | 31% | 23% | 17% |
| March | 260 | 34% | 25% | 19% |
| April | 230 | 32% | 24% | — |
This is how sales cohort analysis reveals changes that are easy to miss in aggregate statistics.

What Can You Learn From a Cohort Matrix?
The most useful approach is not to search for the “perfect percentage,” but to compare groups with one another. If every new cohort has worse retention than the one before it, the issue may lie in the customer’s initial experience, the quality of acquired traffic, or product changes. If retention rises immediately after a new reward mechanic launches, that is a good sign. The next step is to check whether the effect remains after two or three months. Sometimes the first repeat purchase increases, but customers still disappear later. This means the welcome reward worked, yet there is still no lasting reason to return.
That is why customer cohorts are more useful than a single overall Retention Rate. They show precisely when behavior begins to change.
How Does a Loyalty Program Help Collect Data?
A loyalty program is especially useful for cohort analysis because it connects purchases to specific customers. Without this identification, a store sees receipts but cannot always tell who returned and who appeared for the first time. After connecting a program, you can compare, for example:
- cohorts before and after launching rewards;
- customers with and without a digital card;
- buyers who received a welcome reward;
- different cashback terms;
- customers from different advertising channels.
With Loyallyst, purchase history and customer activity are collected in one system, so there is no need to manually combine dozens of spreadsheets. You can see more quickly which groups return more often and which changes actually improved retention.
Cohort analysis does not answer the question “what should we do next?” for you. But it is very good at showing where to look for the answer. If new customers begin returning more often after the loyalty program is introduced, the following cohorts will reveal it. If the effect disappears after a few months, that will also be visible. These insights make it much easier to decide which mechanic to keep, which to adjust, and which to abandon.



Frequently asked questions
Cohort analysis tracks the behavior of similar customer groups over time. Cohorts are formed around a shared event and period, most often the month of the first purchase.
Segmentation describes the customers a business has now, while cohort analysis shows how a group's behavior changed after a specific event.
Choose a period and event, divide new customers into cohorts, calculate the share who returned after 1, 2, and 3 months, and then compare the groups' results.
Read a cohort matrix by rows: each row represents a separate group, while the columns show the share of customers who remained active after a given number of months.
A loyalty program connects purchases to specific customers, stores their activity history, and lets a business compare cohorts before and after launching rewards or other mechanics.