What Is Retention Rate and Why Should Businesses Track Customer Retention?
Reports can look perfectly healthy: advertising brings in customers, the database grows, and orders keep coming. Yet after a few months, one question arises — why is revenue barely changing?
A common reason is that new customers are simply replacing those who left. Someone places their first order today, then buys from a competitor a month later. Another customer takes their place. There is movement on the surface, but no sustainable growth.
Retention Rate helps reveal this situation.
What Is Retention Rate?
Retention Rate shows what share of customers stayed with a company over a specific period. For example, it measures how many customers who were active at the beginning of the month continued making purchases by the end of it.
The term customer retention has a slightly broader meaning. It usually refers to a business's overall ability to keep customers after their first order. Retention Rate, in turn, expresses that ability as a specific percentage.
The difference is significant for a business. The more people return, the less often the company has to start from scratch each month: buying ads again, introducing the audience to the brand, and persuading people to place a trial order.
That is why the Retention Rate metric is useful for online stores, coffee shops, salons, and service companies alike. Only the calculation period changes. In some businesses, a repeat purchase is expected within a week; in others, it may take several months.
Why Does Retention Affect Profit?
Imagine a store that spends about $12 to acquire one customer. The person places an order and never returns. To make the next sale, the store has to pay for advertising again.
If the same customer comes back independently a month later — perhaps because they remember their accumulated bonuses or receive a relevant personalized offer — there is no need to spend separately on acquiring them again.
This does not mean every repeat sale is free. The business still pays for the loyalty program, communications, service, and bonuses. However, the cost of the next order is often lower than the cost of a new customer's first purchase.
Strong retention usually affects several indicators at once:
- the share of repeat orders grows;
- customer LTV increases;
- revenue becomes more stable;
- dependence on constantly expanding advertising decreases;
- more data about customer habits accumulates.
A high rate alone does not guarantee profit. A business can retain customers with overly generous discounts while losing margin. That is why Retention Rate should always be considered alongside revenue, average order value, and the cost of the bonus mechanics.
How Do You Calculate Retention Rate?
The formula is:
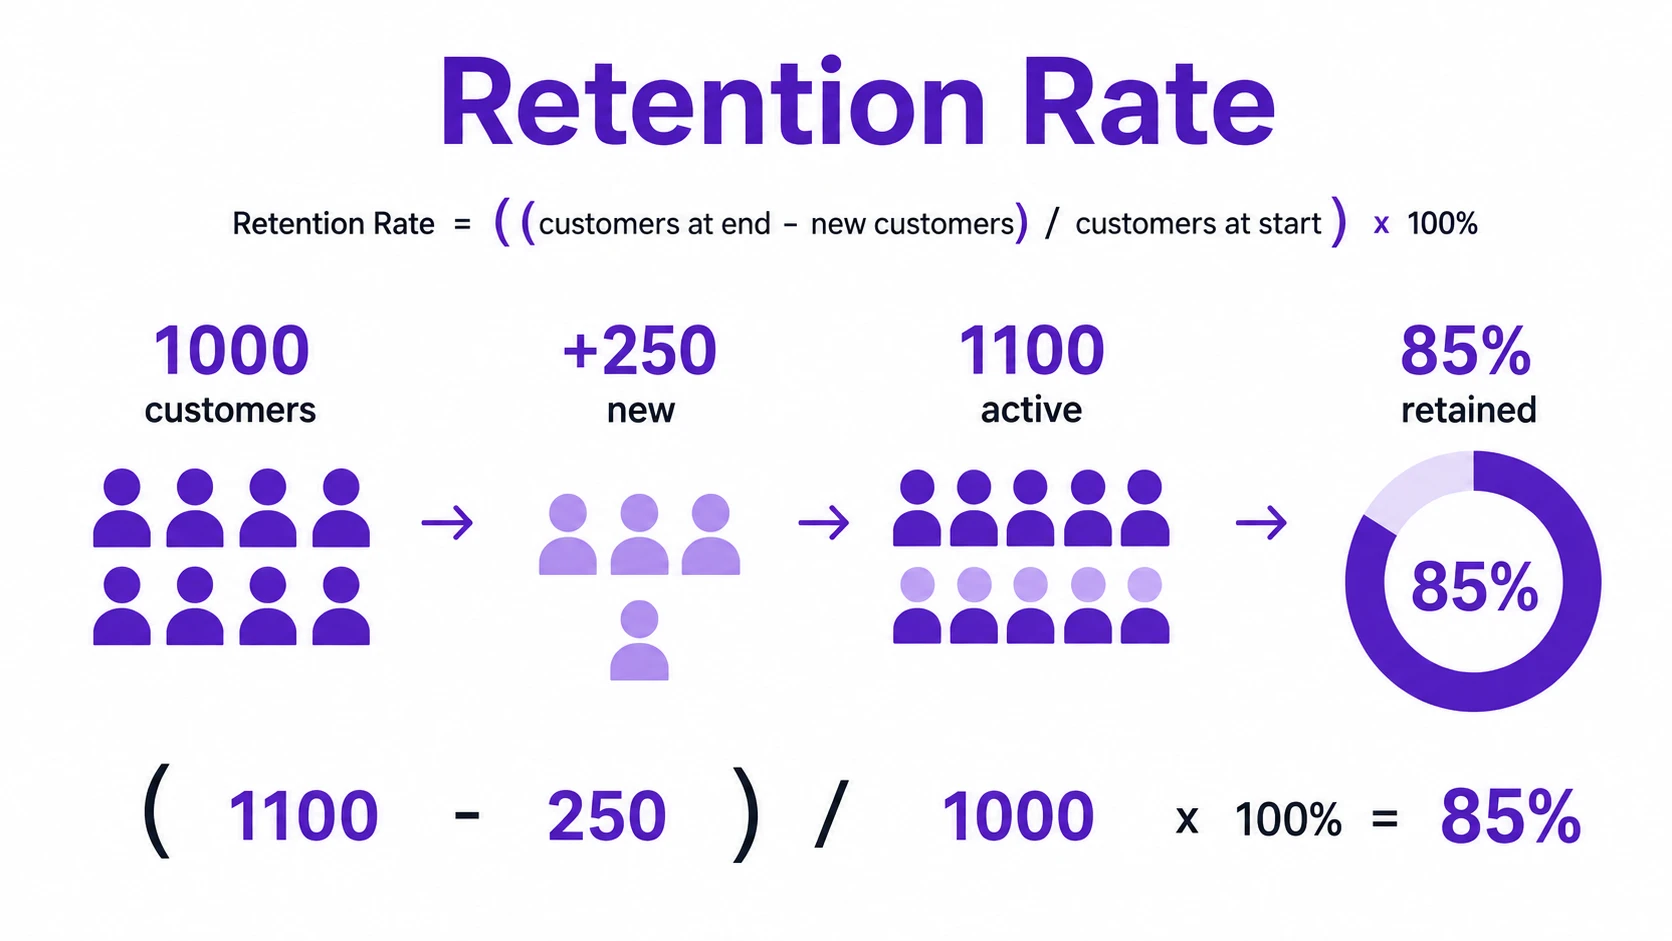
Retention Rate = ((customers at the end of the period − new customers) ÷ customers at the beginning of the period) × 100%
New customers are subtracted from the number of customers at the end of the period. Otherwise, they would artificially inflate the result: the goal is to find out how many people remained from the original group.
Consider a simple example.
At the beginning of the month, a store had 1,000 customers. Over the next four weeks, another 250 new customers arrived, and by the end of the month, 1,100 active customers remained in the database.
Substitute the values:
(1100 − 250) ÷ 1000 × 100% = 85%
This means the store retained 85% of the customers who were in the original group at the beginning of the month. The remaining 15% did not return during the selected period or were no longer considered active under the company's rules.
That is the basic answer to how to calculate Retention Rate. Before calculating it, however, the business must agree on who counts as a customer. Anyone who has ever registered? A buyer who placed an order in the last 30 days? A loyalty-program member who made at least one purchase during the quarter?
Without this definition, the final figure says very little.
What Is a Good Retention Rate?
There is no universal percentage. Even two similar businesses can get different results simply because they measure retention over different periods.
A monthly Retention Rate can be meaningful for a coffee shop because many visitors return several times during that period. A jewelry store has a longer purchase cycle, so a monthly metric provides little useful information. A subscription-based SaaS service measures retention using a different logic altogether.
That is why comparing your result with someone else's benchmark table is not always helpful. It is much more useful to answer three questions:
- How is the metric changing within the business?
- What happened before it increased or decreased?
- Do different customer groups have the same retention rate?
Suppose Retention Rate remained at 62–64% for three months and then fell to 51%. That is already a reason to investigate. Prices may have changed, a successful promotion may have ended, delivery times may have worsened, or some customers may have stopped receiving reminders.
In other words, a good result is not an abstract percentage. It is one that matches the company's purchase cycle, does not deteriorate over time, and supports healthy sales economics.
What Should You Do After the Calculation?
Calculating the rate is the easiest part. Understanding why it changed is harder.
The overall number often hides important details. New customers may rarely return while regular customers continue buying steadily. Or one branch may retain 70% of visitors while another barely reaches 45%. The average smooths out this difference even though the problem is already visible.
That is why retention in marketing is analyzed by segment:
- by branch and sales channel;
- by first-purchase date;
- by product category;
- by average order value;
- by participation in the loyalty program;
- by promotions and promo codes used.
This makes it easier to see where to look for the cause. If customers who received a bonus after their first order return noticeably more often than others, that mechanic can be developed further. If a promotion generated many one-time purchases but barely affected retention, repeating it in the same form probably makes little sense.
A Hypothetical Example: What Retention Rate Can Show
Imagine a chain of car washes. The flow of new visitors remains steady and advertising works, but monthly revenue barely grows.
The analysis shows that the customer Retention Rate is 41%. In other words, more than half of customers do not return during the selected period.
The company launches a simple scenario. After the first visit, the customer receives bonuses that can be used on the next car wash. Two weeks later, the program sends a balance reminder — not to everyone, but only to those who have not yet returned.
Several months later, retention is measured again. If the rate grows together with the number of repeat orders and revenue, it is reasonable to assume the scenario worked. However, evaluating only Retention Rate is still risky: growth may have resulted from seasonality, a price change, or another advertising campaign.
Actual results are therefore best tested using comparable customer groups and equal periods.
How Does a Loyalty Program Help Retain Customers?
People do not always leave because of a bad product. Sometimes the reason is much simpler: the company has simply stopped appearing in front of them.
Yesterday a customer visited your coffee shop; today they walked down another street and bought coffee elsewhere. A week later, the new place has already become a habit. There was no conscious decision to reject the brand.
A loyalty program helps maintain contact after a purchase. It can be used to:
- credit bonuses toward the next order;
- remind customers when those bonuses expire;
- suggest a product from a category familiar to the customer;
- launch a separate scenario for customers who have not returned for a long time;
- compare loyalty-program members' behavior with that of other customers.
Automation is especially important here. Manually tracking thousands of customers is impossible, but a system can notice when someone has fallen out of their usual rhythm. For example, they used to make a purchase every three weeks, but a month and a half has passed since their last order.
This does not necessarily mean the customer has left. It does, however, create the right moment to send a reminder — calmly and without offering a blanket discount to the entire database.
Which Metrics Should You Track Alongside Retention Rate?
One metric cannot explain exactly what is happening with sales.
Average order value shows how much retained customers spend. Purchase frequency shows how often they return. LTV helps estimate a customer's total value over the entire relationship with the company.
Churn Rate, or the share of customers who leave, is also useful. In a simple calculation, it often complements Retention Rate: if retention is 85%, churn is 15%. In more complex models, the calculation rules may differ, so the definitions should be fixed in advance.
It is also worth tracking the cost of bonuses and discounts. Retention may grow, but if the company provides overly generous rewards to achieve it, the financial result will be weak.
Why Should Retention Be Tracked Regularly?
One calculation provides only a snapshot of the selected period. Decision-making requires a trend.
If the retention metric declines for a third consecutive month, the problem can be identified before sales fall significantly. If the rate increases after a loyalty-program change, the result should be checked across segments and against other metrics. This will show whether more customers really returned or whether external circumstances affected the figure.
The question “how is retention calculated?” is therefore only the beginning. The main work starts after the calculation: finding groups with a high risk of churn, investigating the reasons, and choosing a return scenario.
A loyalty program simplifies this process. It connects purchases with specific customers, tracks pauses between orders, and helps launch personalized offers at the right time. The Retention Rate indicator then stops being just a line in a report. It becomes a way to understand why customers stay — or why they eventually leave.




Frequently Asked Questions
Retention Rate shows what share of customers stayed with a company over a specific period and continued making purchases.
Subtract new customers from the number of customers at the end of the period, divide the result by the number of customers at the beginning, and multiply by 100%.
There is no universal benchmark. A good Retention Rate matches the company's purchase cycle, does not deteriorate over time, and supports healthy sales economics.
Regular tracking reveals the trend and helps identify retention problems before repeat sales decline significantly.
A loyalty program connects purchases with individual customers, tracks pauses between orders, and helps launch bonuses, reminders, and personalized offers at the right time.