How a Loyalty Program Increases LTV by 3–5x
The first study in Ukraine based on real transactional data from 490,000+ customers
Loyallyst Analytics | January 2026
Methodology:
We analyzed aggregated data from the Loyallyst platform for the period from January to December 2025. The sample includes only Ukrainian HoReCa businesses: coffee shops, cafés, and restaurants.
Scale:
- 540 venues
- 494,133 loyalty program users, of which 110,013 were used for in-depth analysis
- 3,332,748 transactions per year, of which 1,867,960 were used for detailed analysis
Executive Summary: 5 Key Findings
1. A Loyalty Program Increases Customer LTV by 3–5x
Customers who use a loyalty program generate several times more revenue over their lifetime:
- LTV (customer lifetime value) with a loyalty program — ~3,877 UAH
- LTV (customer lifetime value) without a loyalty program — 900–1,500 UAH
2. Retention Leaders: Loyalty Programs Deliver 84% Retention in Coffee Shops
Customer retention rates over 12 months after the first visit:
- Coffee shops: 83.66%
- Cafés: 76.96%
- Restaurants: 59.11%
- WITHOUT a loyalty program: ~20% (according to industry benchmarks)
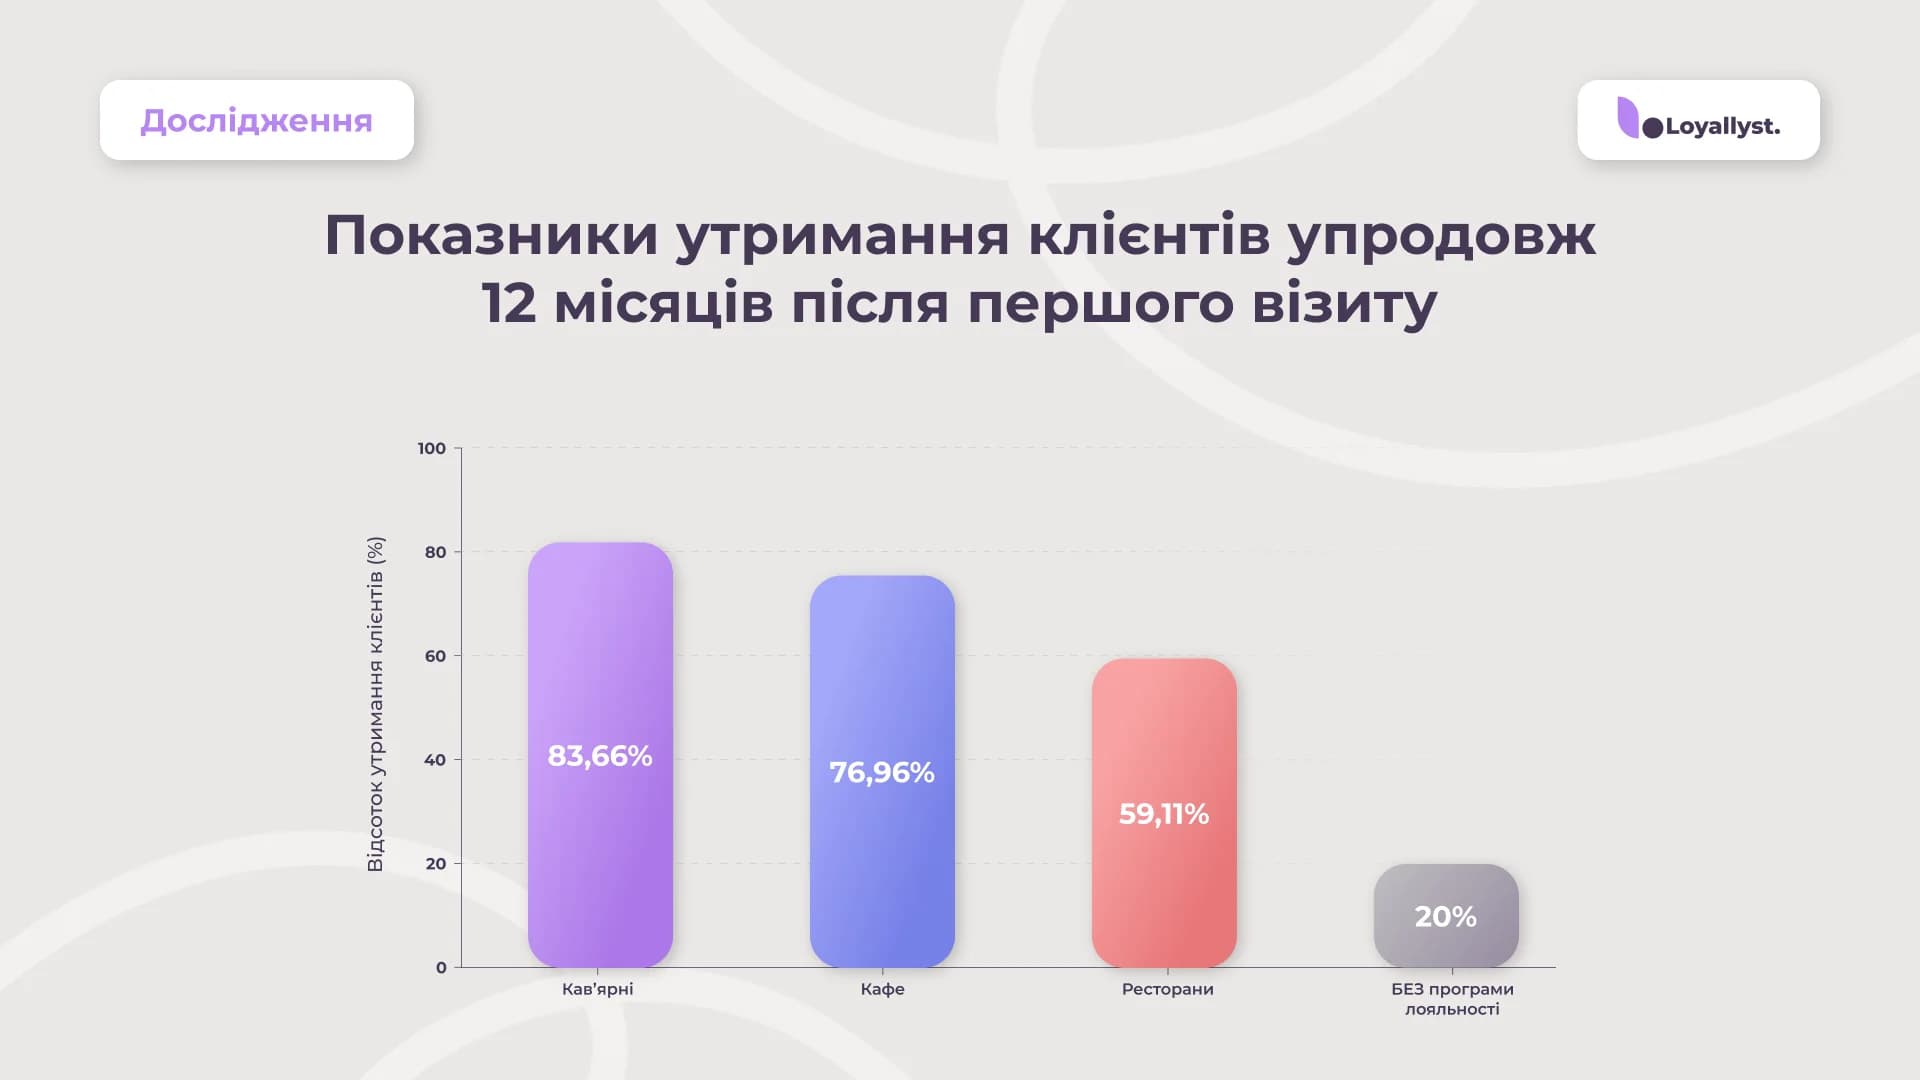
This means that loyalty program in a coffee shop increases Retention by 2.5–5x. In coffee shops, customers who received a bonus during their first visit have an 84% probability of returning within a year. Without a loyalty program, one in five customers does not return.
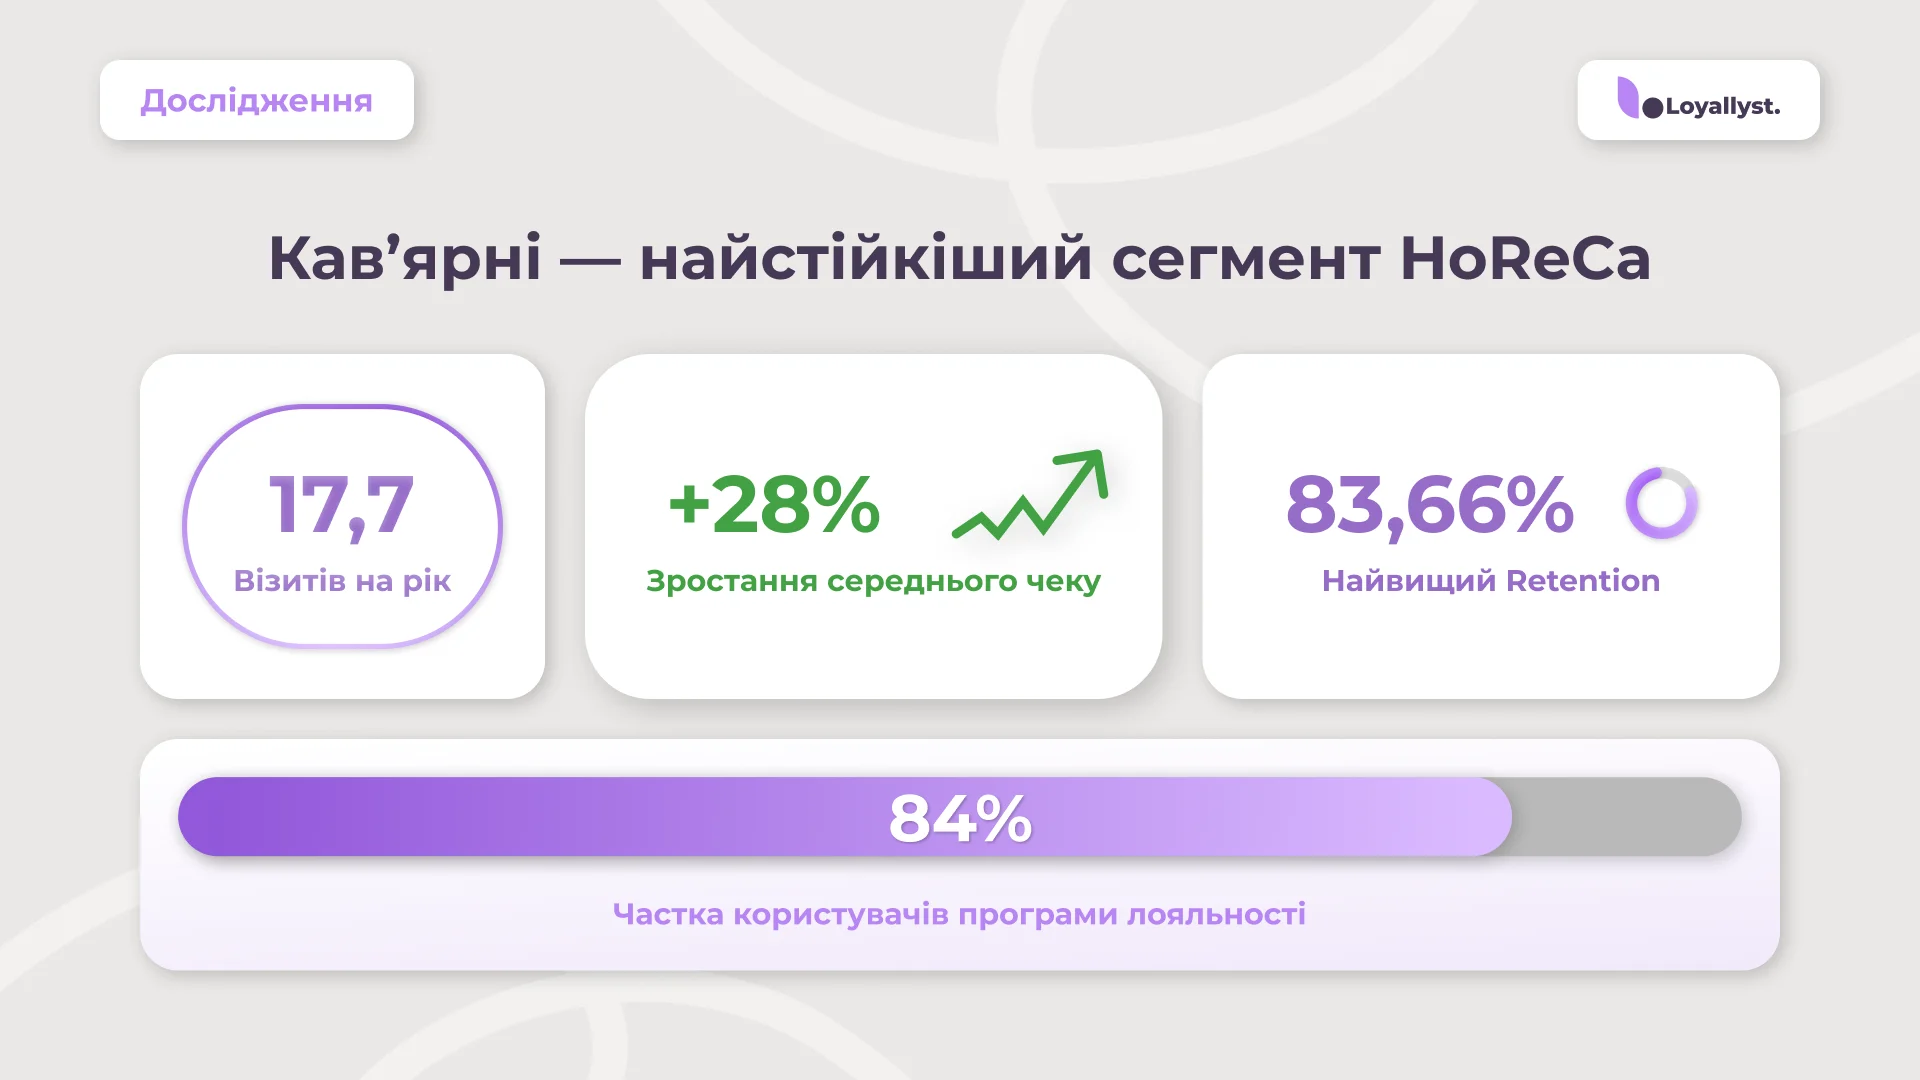
3. Coffee Shops — The Most Resilient HoReCa Segment
- 17.7 visits per year
- Average check increased by 28%
- Highest Retention: 83.66%
- Largest market share: 84% of loyalty program users
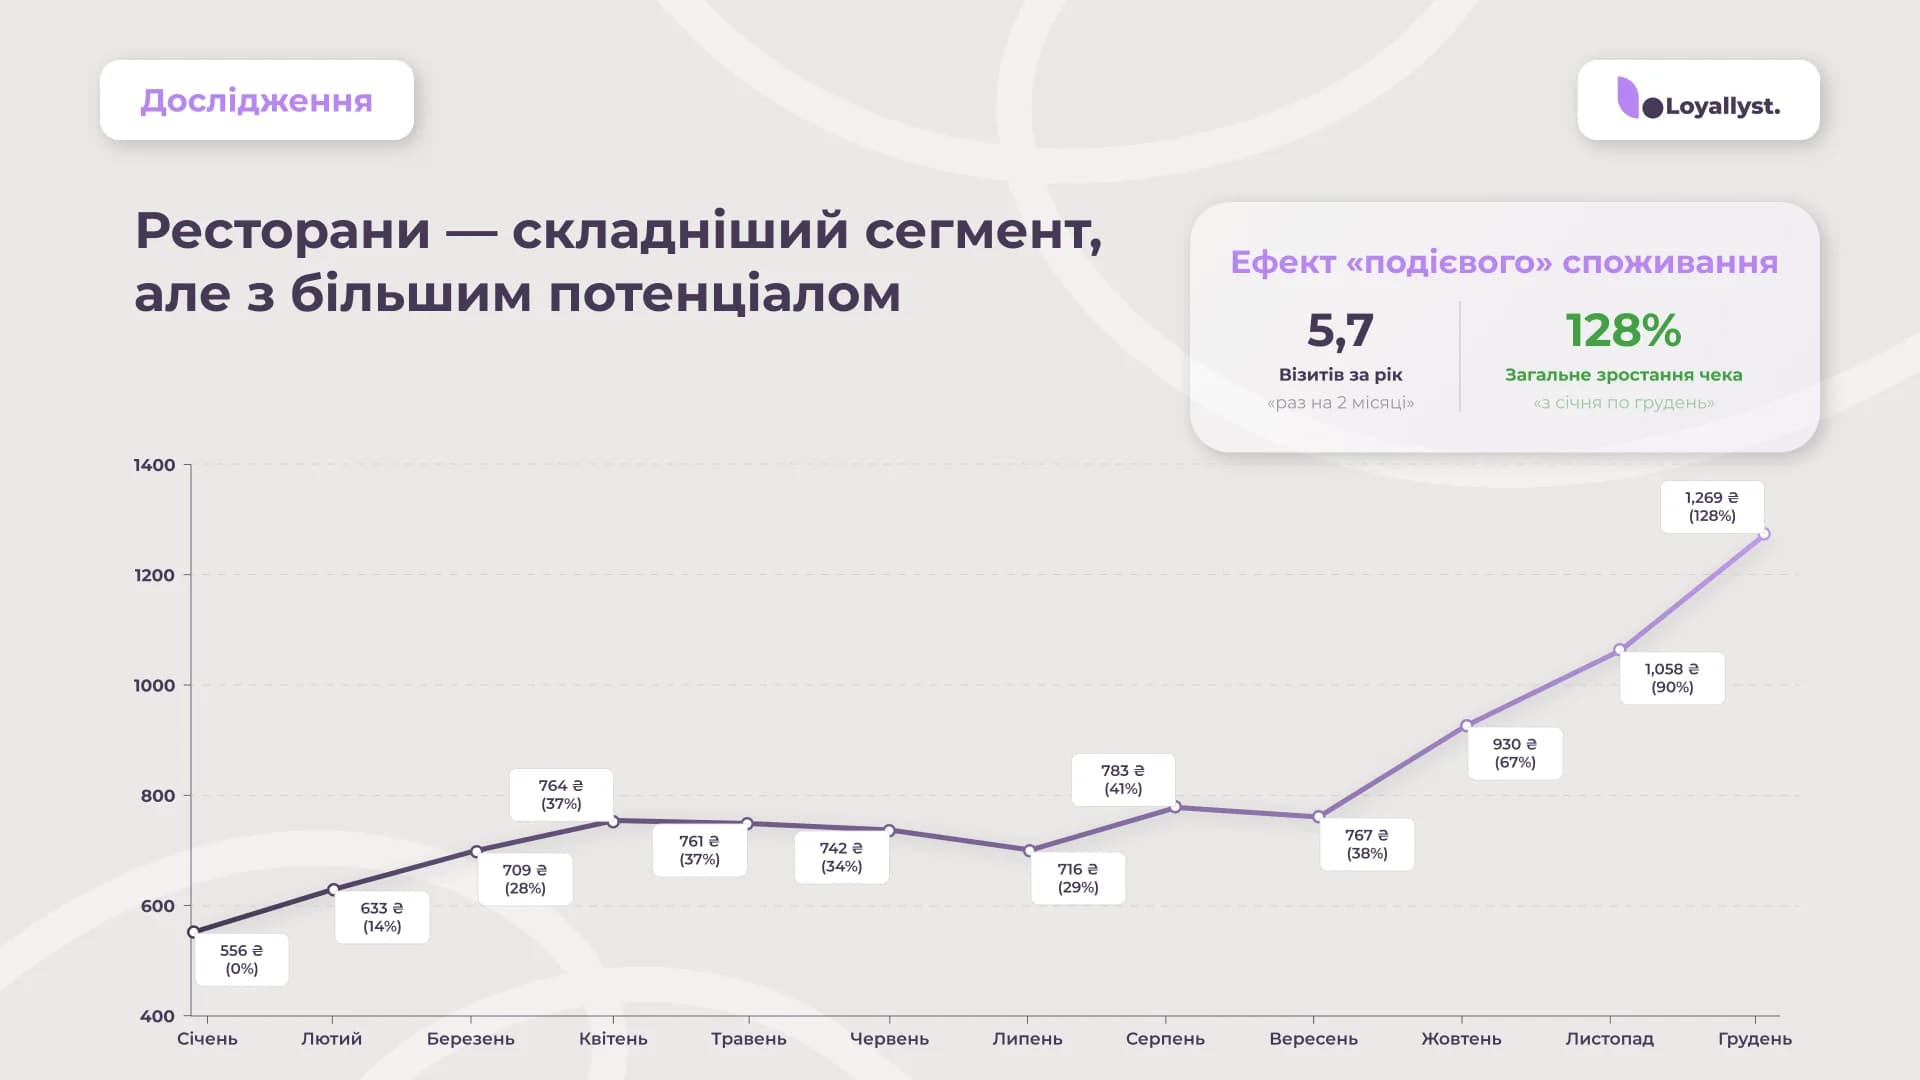
4. Restaurants — A More Complex Segment with Greater Potential
Restaurants showed the lowest Retention (59%) but also the most active growth in average check:
- 5.7 visits per year (once every 2 months)
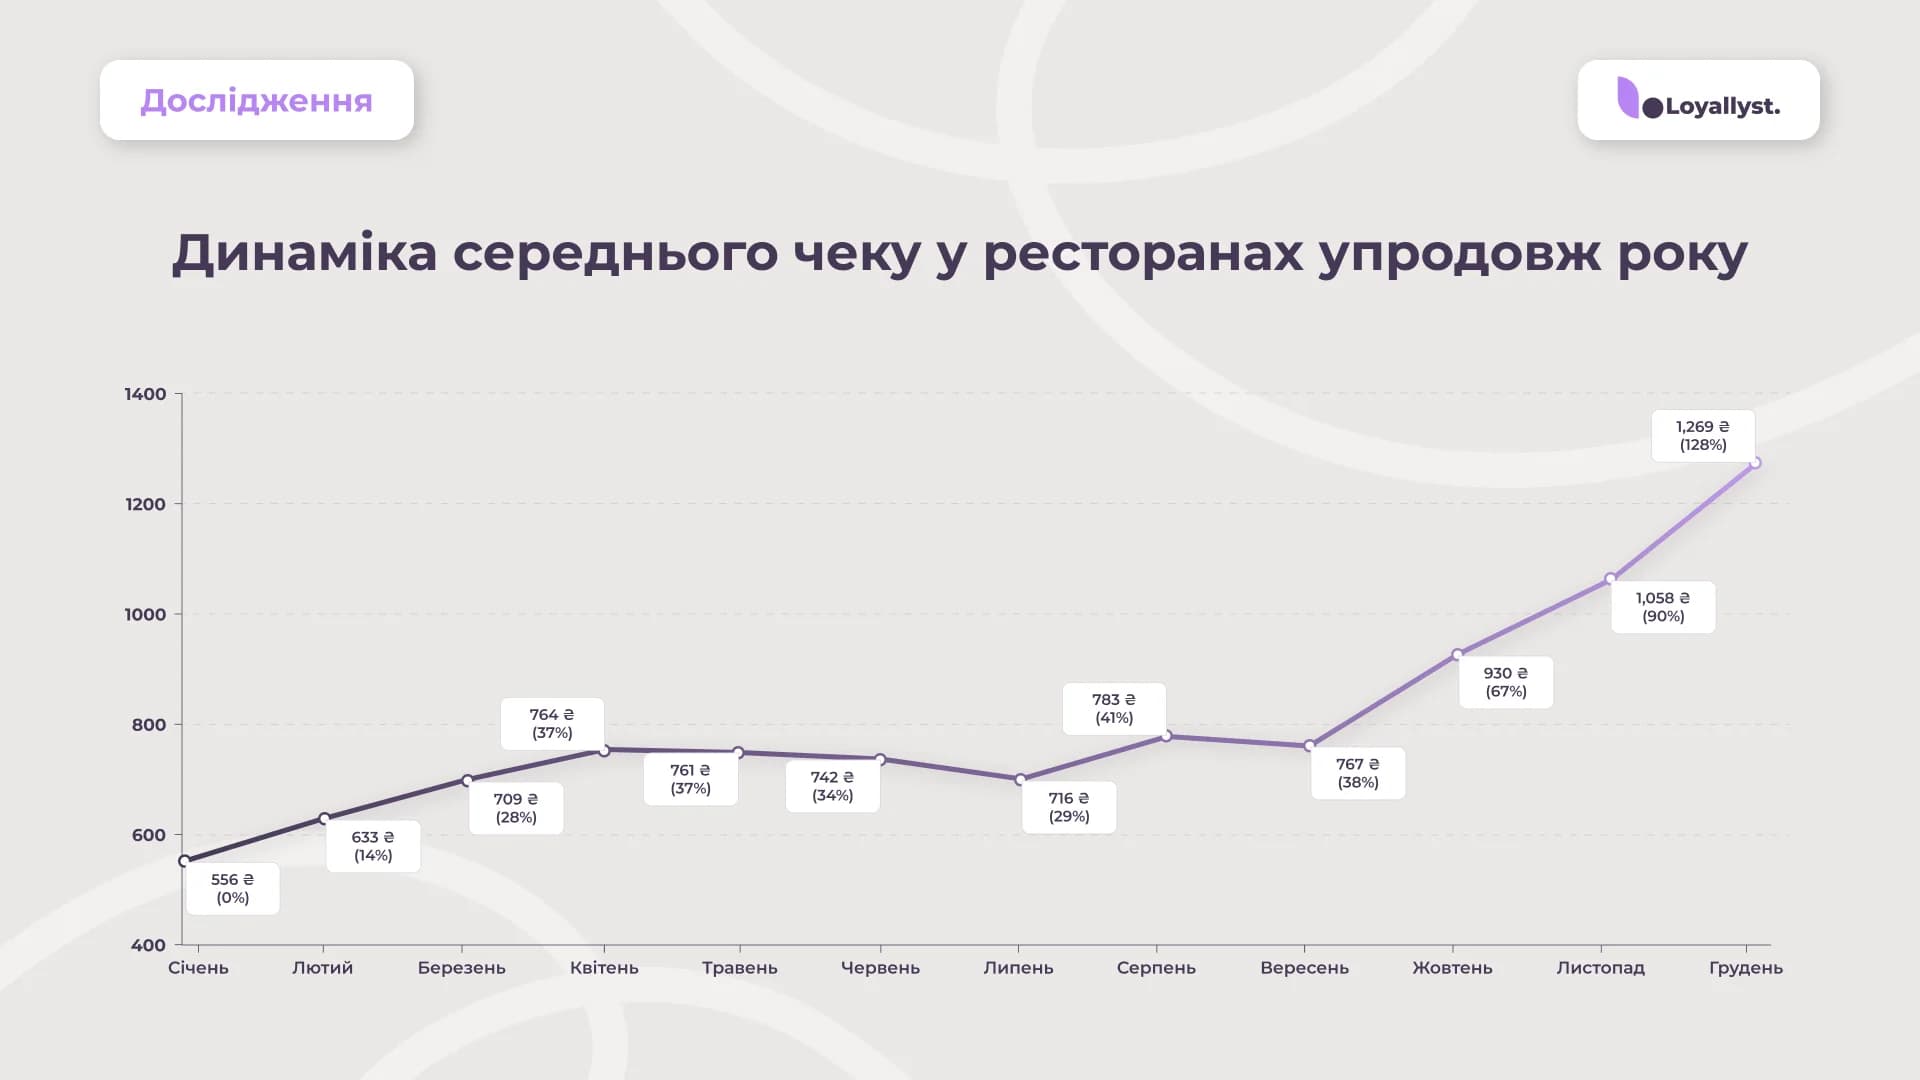
- Average check increased by 128% — from 556 UAH in January to 1,269 UAH in December
- Strong autumn growth: starting in October, the average check rose sharply (+67%, +90%, +128%)
5. The Return Window — The First 4 Days
The average time between a customer’s first and second visit is 4 days. If a customer returns within the first week, the probability of becoming a regular increases significantly. If there is no repeat visit within two weeks, retaining that customer becomes extremely difficult.
The Economic Context of HoReCa in Ukraine, 2025
The year 2025 for HoReCa can be described as “cautious optimism.”
What changed:
Visits became less frequent but more deliberate. The number of spontaneous visits decreased. Customers no longer enter the first coffee shop they see — they choose places where they feel recognized.
Expectations for speed and service quality increased. AI review analysis showed that 42% of negative reviews are related to service and staff, 28% to service speed, while product quality was mentioned in only 20%. People are willing to forgive an imperfect taste — but not long waits or rude behavior.
The Big Picture: Scale and Metrics
Distribution by Segment:
Below is a detailed breakdown of metrics across the three main HoReCa market segments (coffee shops, cafés, restaurants), based on data from 110,013 users and 1,867,960 transactions.
Coffee shops dominate not only in the number of customers but also in transaction share. A high visit frequency (17.7 per year) compensates for a lower average check. Restaurants, on the other hand, account for the smallest number of transactions (only 2% of the total volume), yet have the highest average check.
Lifetime Value (LTV):
Customer lifetime value (LTV) is the total revenue a customer generates for a business over the entire period of interaction. We calculated the customer lifecycle for each segment and compared it with the estimated LTV in the absence of a loyalty program.
| Segment | LTV with Program | LTV without Program (estimate) | Growth Factor |
|---|---|---|---|
| Coffee Shops | 3,125 UAH | ~900 UAH | ×3.7 |
| Cafés | 4,476 UAH | ~1,200 UAH | ×4.6 |
| Restaurants | 3,044 UAH | ~1,400 UAH | ×3.0 |
According to our calculations, LTV for customers with a loyalty program is 125% higher than the baseline, which equals 211% of LTV without a program (~1,500 UAH).
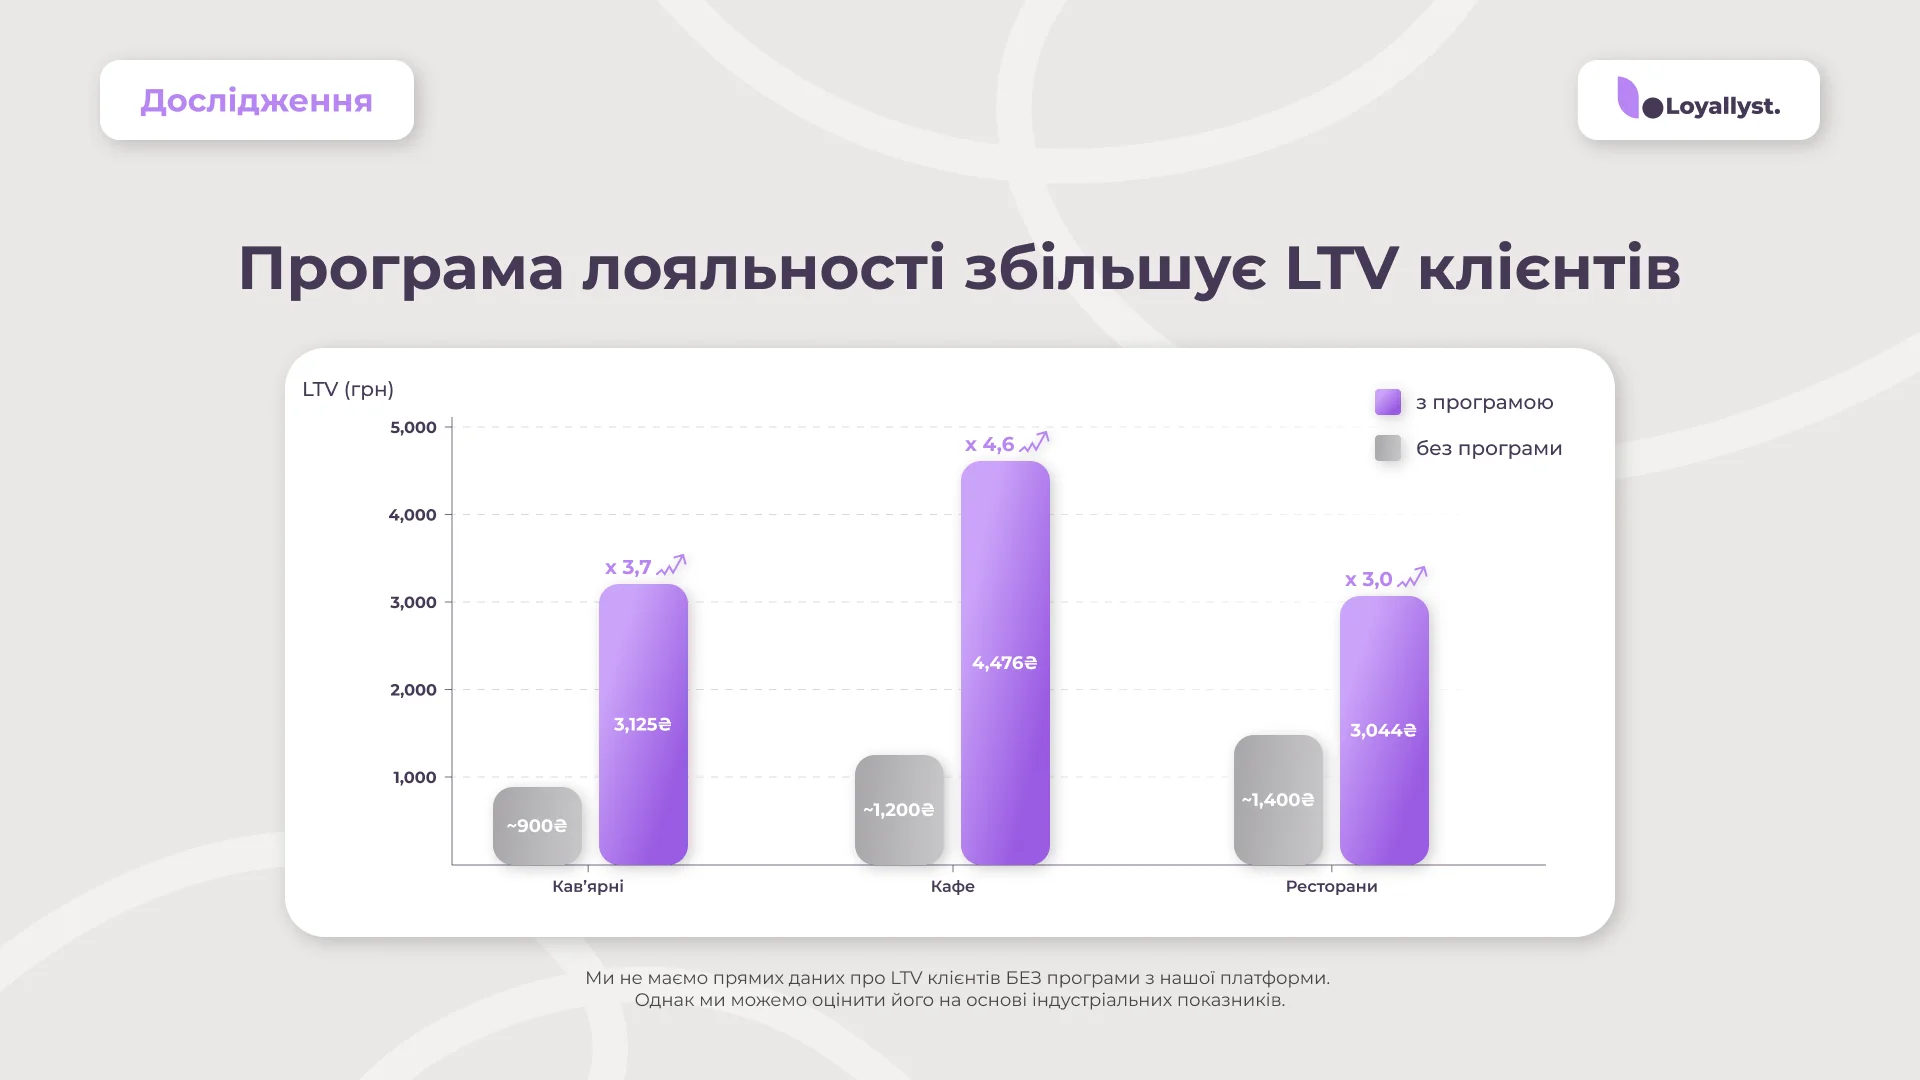
*We do not have direct data on LTV for customers WITHOUT a program from our platform. However, we can estimate it based on industry benchmarks.
If we assume that customers without a loyalty program visit venues 2–3 times less frequently and spend 30–40% less per visit, the estimated LTV would range from 900 to 1,500 UAH depending on the segment.
Conclusion: loyalty program increases LTV by 2–4 times.
Industry benchmarks confirm these calculations.
Retention Rate:
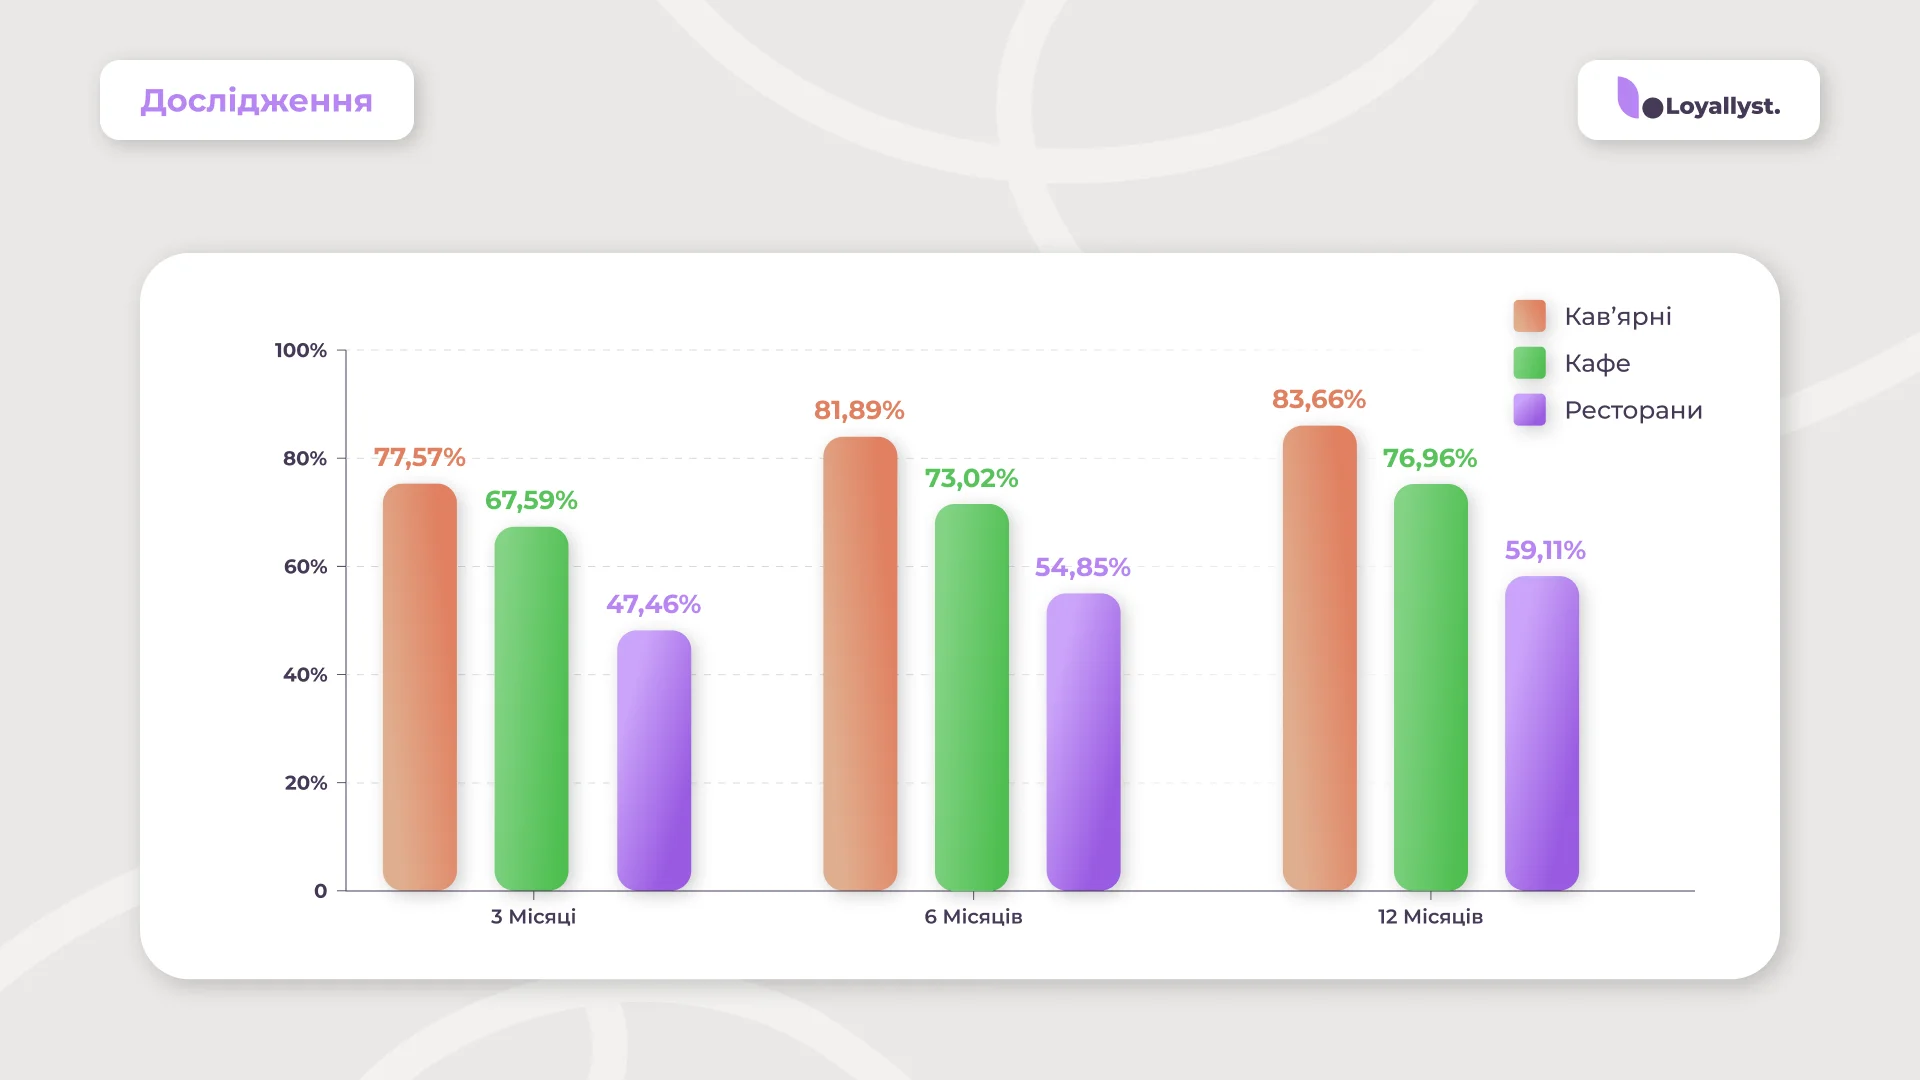
| HoReCa Segment | 3 Months | 6 Months | 12 Months |
|---|---|---|---|
| Coffee Shops | 77.57% | 81.89% | 83.66% |
| Cafés | 67.59% | 73.02% | 76.96% |
| Restaurants | 47.46% | 54.85% | 59.11% |
Interestingly, the Retention rate does not decline over time — on the contrary, it shows growth.
This means that customers who pass the “critical window” of the first 3 months become more loyal. The longer a customer uses a loyalty program, the stronger their connection to the brand and the lower the probability that they will switch to a competitor (accumulated bonuses, habit, emotional attachment).
Bonus ROI:
The effectiveness of loyalty mechanics is measured by how many hryvnias of revenue each hryvnia invested in bonuses generates (Bonus ROI).
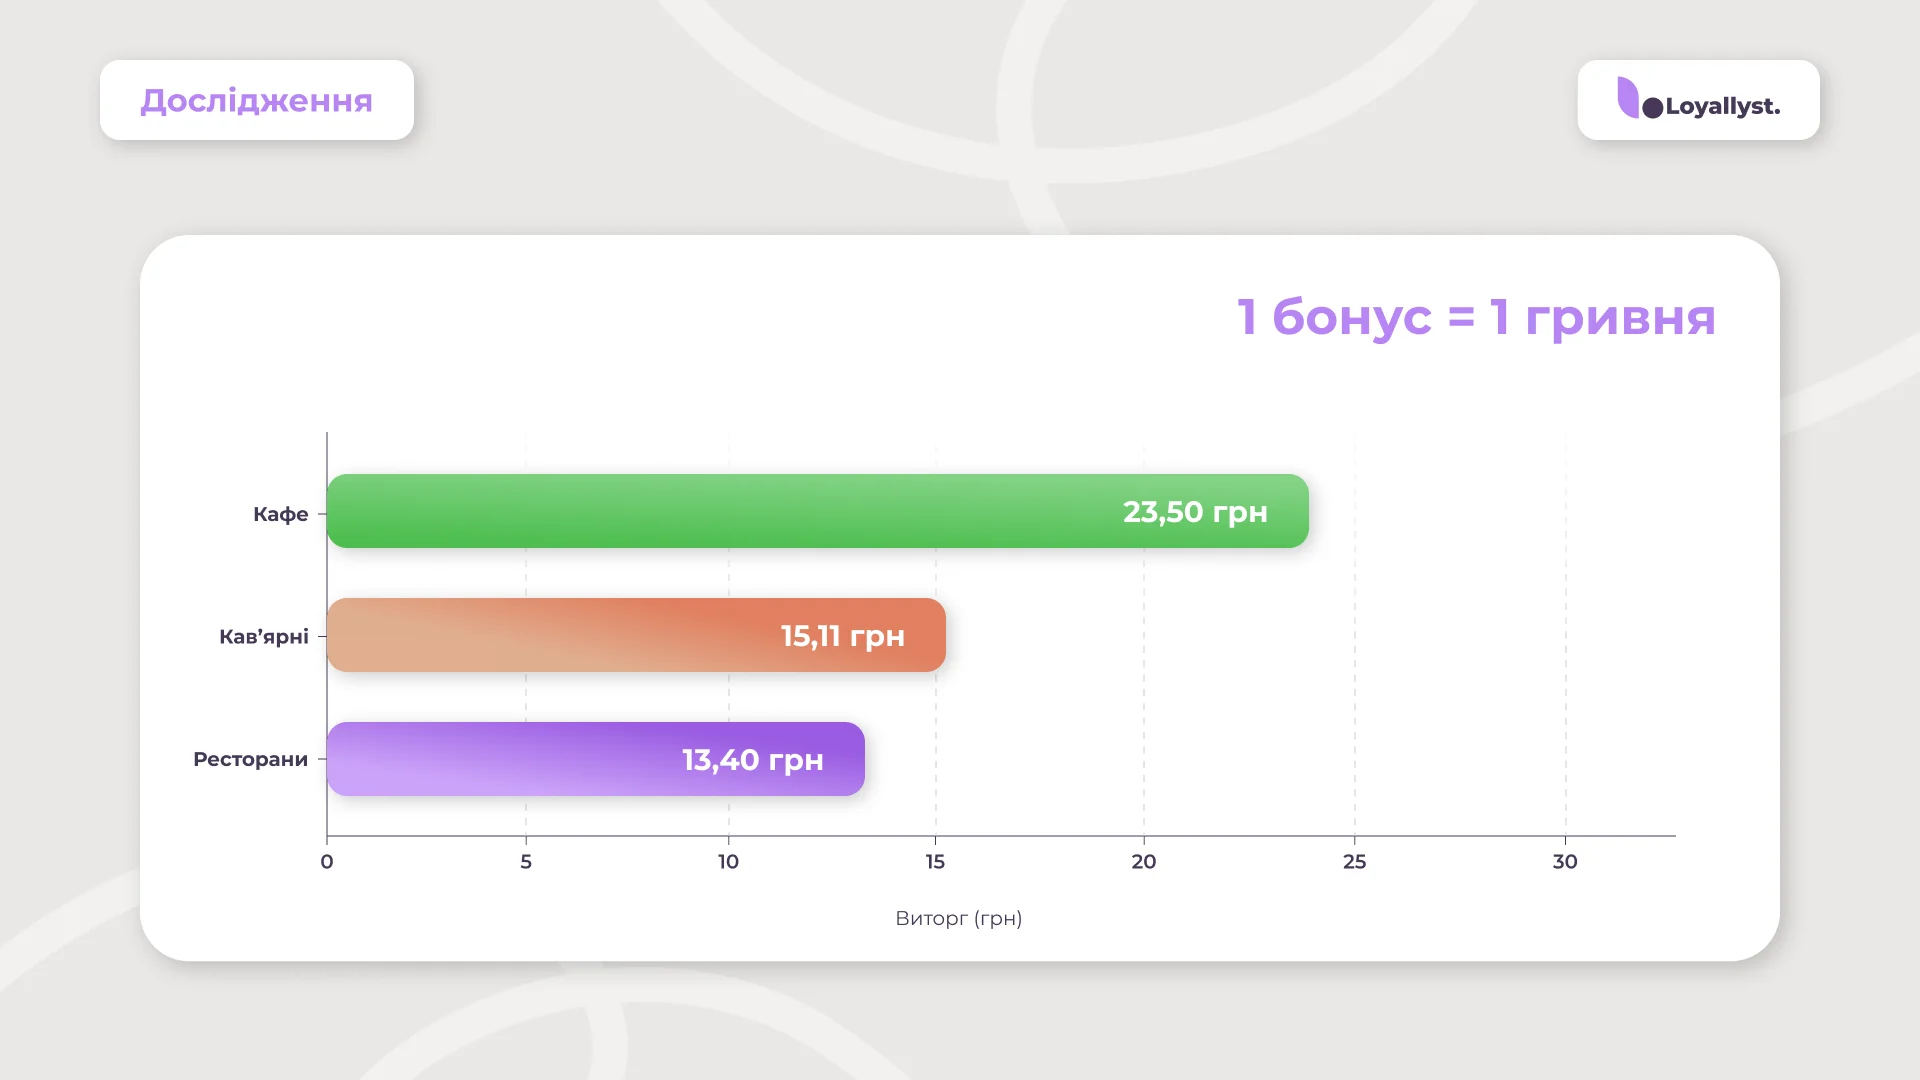
Revenue from 1 UAH spent on bonuses:
| Segment | Bonus ROI | Interpretation |
|---|---|---|
| Cafés | 23.50x | Every 1 UAH in bonuses → 23.50 UAH revenue |
| Coffee Shops | 15.11x | Every 1 UAH in bonuses → 15.11 UAH revenue |
| Restaurants | 13.40x | Every 1 UAH in bonuses → 13.40 UAH revenue |
Cafés have the optimal balance between average check (160–260 UAH) and visit frequency (17.2 per year). The check is comfortable enough to encourage adding a dessert, but not as high as in restaurants. Frequent visits allow customers to regularly earn and redeem bonuses, building a habit of returning.
Overall Loyalty Program ROI:
For every 1 UAH invested in a loyalty program, a business receives 2.46 UAH in revenue, or 146% return on investment (ROI).
Average time between the first and second visit — 4 days:
This is a critical activation period. Automated trigger messages sent on the 5th day after the first visit significantly increase Retention.
Automation Effectiveness:
According to our data, 27.69% of customers return within 14 days after receiving an automated trigger message. That’s one in four customers.
Practical Recommendation:
Set up automation: on the 5th day after the first visit, send the guest a personalized offer. For example: “We miss you! We’ve prepared 50 UAH in bonuses for your next visit.” This will increase your Retention and ensure ROI growth through higher LTV.
Segment Profiles
Coffee Shops
Key Metrics:
- LTV: 3,125 UAH
- Average check: 131 UAH (across all transactions) → 176 UAH (active program users)
- Purchases per year: 17.7 (almost 1.5 times per month)
- 12-month Retention: 83.66%
Growth Driven by the Loyalty Program:
- LTV: +247% (3,125 UAH compared to ~900 UAH without a program)
- Average check: +34–47% (176 UAH compared to 120–131 UAH without a program)
- Retention: +337% (84% compared to ~20% without a program)
Average Check:
The average check in coffee shops increased by 28% over the year — from 109.87 UAH in January to 140.52 UAH in December. Annual average check: 131 UAH.
Transaction Seasonality:
The activity peak was recorded in September — 187,638 transactions. This is 137% more than in January (78,958 transactions). The end of summer, return from vacations, and the beginning of autumn contribute to people resuming their usual routines.
The decline in activity occurs in January–February, the post-holiday period when people cut spending after New Year expenses.
Conclusion: Coffee shops are the most predictable segment with high visit frequency, a stable check, and the highest Retention. The longer a customer uses a venue’s loyalty program, the harder it becomes for them to switch to a competitor.
Cafés
Cafés demonstrated the highest LTV and the best bonus ROI among all segments.
Key Metrics:
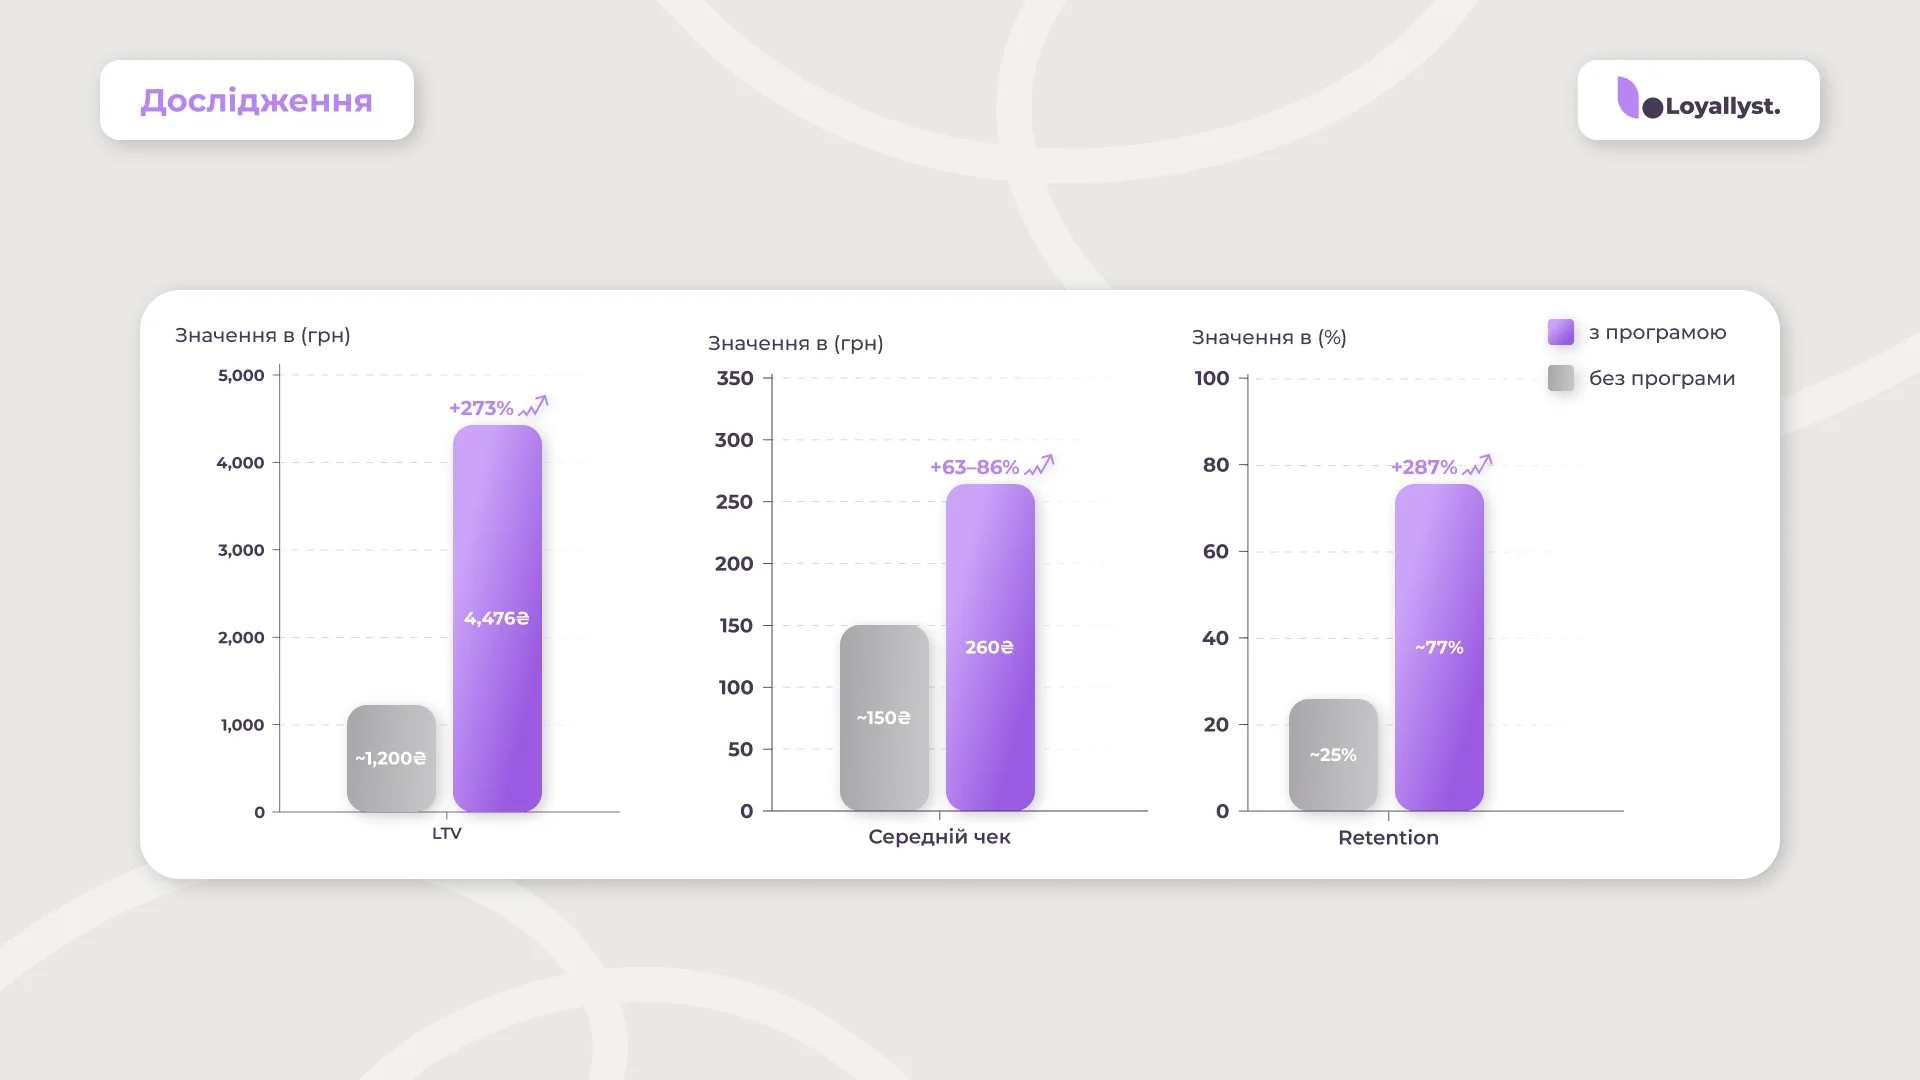
- LTV: 4,476 UAH
- Average check: 160 UAH (across all transactions) → 260 UAH (active program users)
- Purchases per year: 17.2
- 12-month Retention: 76.96%
Growth driven by a loyalty system in a café:
- LTV: +273% (4,476 UAH compared to ~1,200 UAH without a program)
- Average check: +63–86% (260 UAH compared to 140–160 UAH without a program)
- Retention: +287% (77% compared to ~25% without a program)
Average Check and Seasonality:
154–168 UAH (fluctuation ±10 UAH) — the lowest seasonality among all segments. Cafés are less dependent on holidays and corporate events than restaurants and do not experience the summer–winter fluctuations typical for coffee shops.
Annual average check: 160 UAH.
Highest LTV and ROI Among All Segments
4,476 UAH — 43% higher than coffee shops and 47% higher than restaurants. Customers visit almost as frequently as in coffee shops (17.2 times per year) but spend nearly twice as much per visit (260 UAH compared to 131 UAH).
Best Bonus ROI
Every 1 UAH invested in bonuses generates 23.50 UAH in revenue — 1.6 times more than coffee shops (15.11x) and 1.75 times more than restaurants (13.40x).
Our hypothesis: the psychology of a small reward. Bonuses lower the threshold for adding an “extra” dessert or takeaway coffee: “I have 50 UAH in bonuses — why not get a cheesecake too?”
Restaurants
Despite having the lowest Retention, this segment stands out for the highest average check and the strongest growth throughout 2025.
Key Metrics:
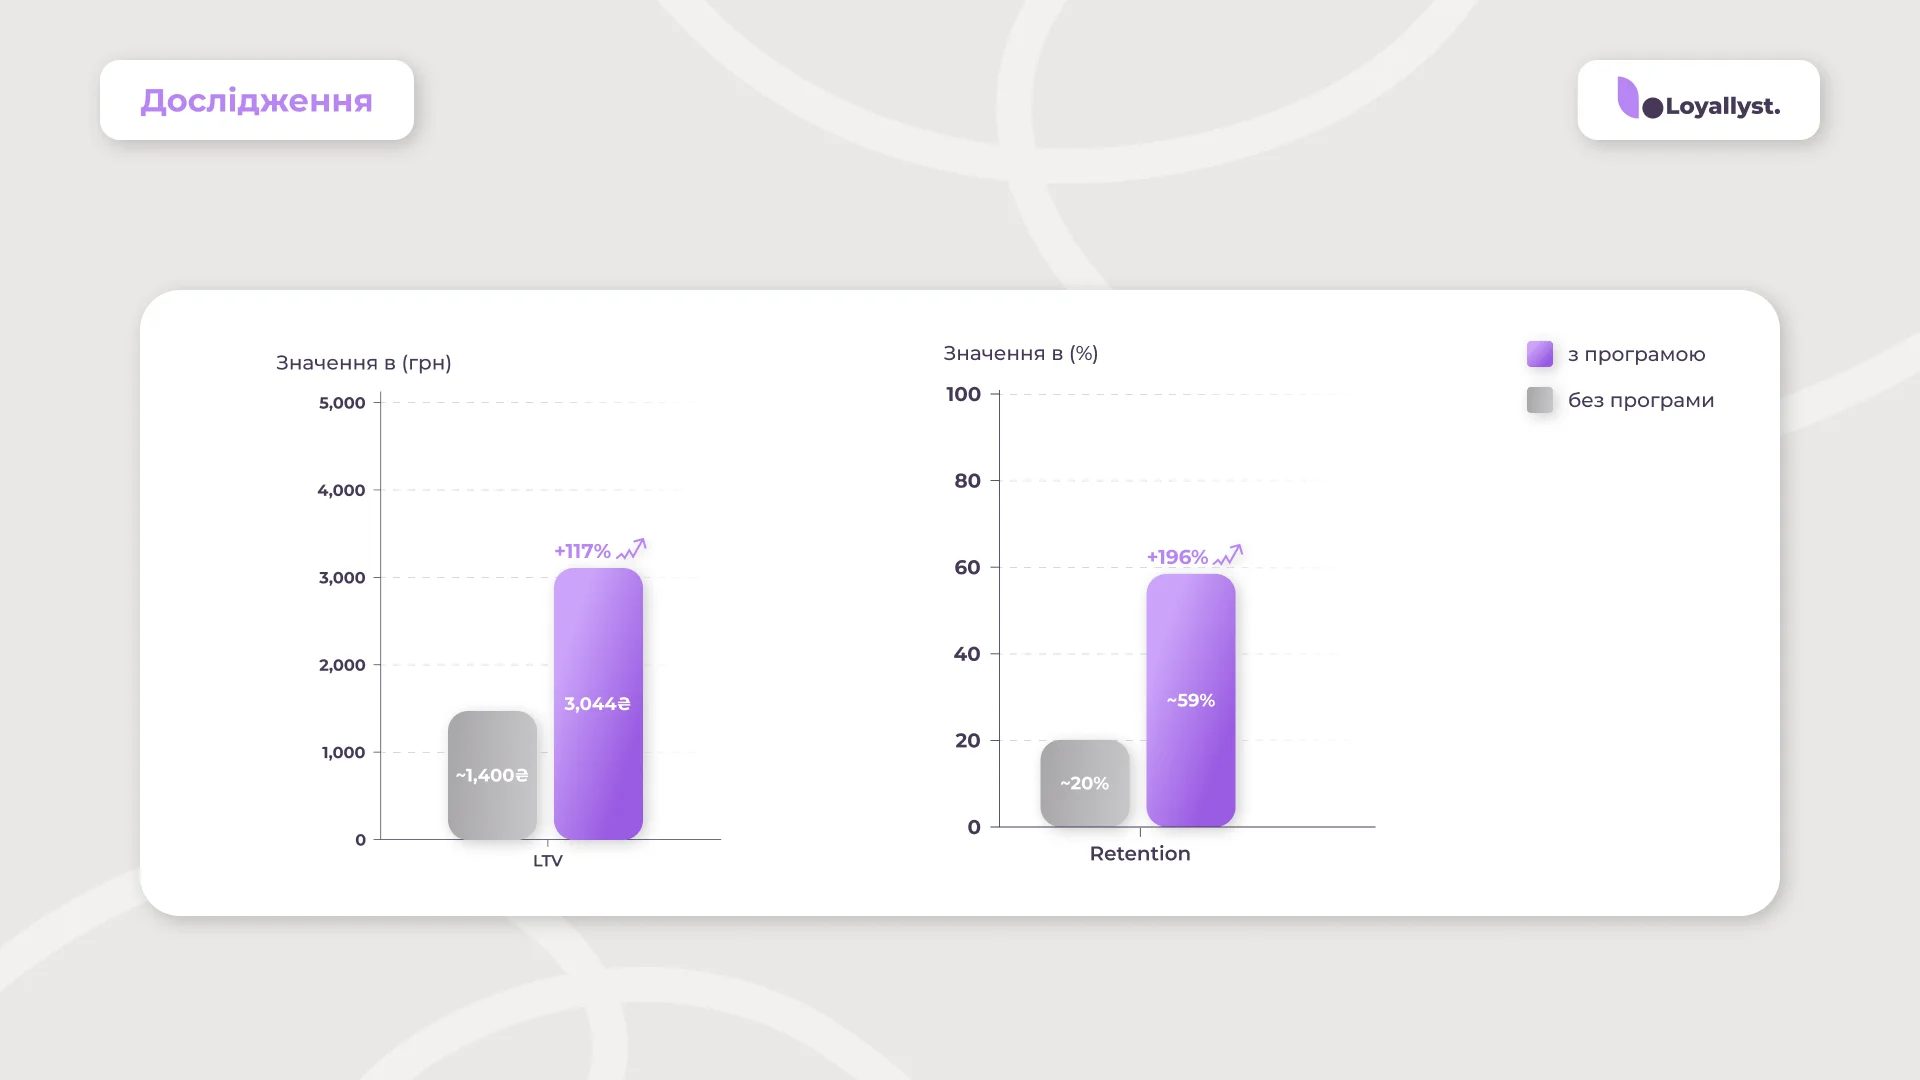
- LTV: 3,044 UAH
- Average check: 534 UAH (actual for active users) → 816 UAH (weighted, including holiday impact)
- Purchases per year: 5.7 (once every 2 months)
- 12-month Retention: 59.11% (every second customer does not return)
Growth driven by a loyalty program in a restaurant:
- LTV: +117% (3,044 UAH compared to ~1,400 UAH without a program)
- Retention: +196% (59% compared to ~20% without a program)
Restaurant Challenges:
1. Lowest Retention.
2. Infrequent visits.
3. High sensitivity to economic conditions.
During economic instability, people primarily cut spending on restaurants. Unlike coffee (a daily habit) or cafés (a regular leisure option), restaurant visits are usually event-driven — birthdays, anniversaries, corporate dinners. If budgets are tight, such occasions are either reduced or moved to cafés or home settings.
4. “Occasion-based” instead of habitual.
Customers visit restaurants not casually, but with a specific reason. This makes their behavior less predictable.
Restaurant Advantages:
1. Highest average check.
534–816 UAH — 6 times higher than in coffee shops. One restaurant visit equals five coffee shop visits in terms of revenue.
2. Seasonality.
The average check increased by 128% over the year — from 556 UAH in January to 1,269 UAH in December. October–December is the “golden period” for restaurants. The check grows exponentially (+67%, +90%, +128%).
3. High LTV when customers are retained.
Despite infrequent visits, restaurant LTV (3,044 UAH) is almost equal to coffee shop LTV (3,125 UAH).
Restaurants are a high-risk, high-reward segment. Despite low Retention, retaining one restaurant customer generates as much revenue as a coffee shop customer who visits three times more often.
Average Check by Month:
| Month | Average Check | Growth vs January |
|---|---|---|
| January | 555.58 UAH | baseline |
| February | 632.97 UAH | +14% |
| March | 708.57 UAH | +28% |
| April | 763.61 UAH | +37% |
| May | 761.30 UAH | +37% |
| June | 742.41 UAH | +34% |
| July | 715.92 UAH | +29% |
| August | 782.94 UAH | +41% |
| September | 767.31 UAH | +38% |
| October | 930.41 UAH | +67% |
| November | 1,058.36 UAH | +90% |
| December | 1,268.83 UAH | +128% |
Annual Average Check: 816 UAH
How Can Restaurants Increase Retention?
1. Higher cashback: 7–10%.
To motivate customers to return, a stronger incentive is required — for example, 7–10% cashback. It can be applied to specific menu categories only.
2. Personalization.
Use every opportunity to stay in touch:
- Reminders about special offers;
- Birthday bonuses (e.g., double cashback);
- “We miss you” messages after 2 months of inactivity;
- Personalized offers based on previous orders (“Your favorite wine is back in stock”);
- etc.
3. Fast response to negative feedback.
AI review analysis showed: customers who left a negative review are more likely to return if the restaurant addresses the complaint within the first 24 hours.
4. Emotional connection.
“Your favorite table,” “Your favorite wine,” “We remember you don’t eat spicy food” — this is not about transactions, it’s about relationships.
An effective retention strategy can increase Retention from 59% to 70–75%, generating an additional 20–30% in revenue without spending on customer acquisition.
Comparative Table:
| Characteristic | Coffee Shops | Cafés | Restaurants |
|---|---|---|---|
| Business Model | Daily habit | Regular leisure | Occasion-based |
| Visits per Year | 17.7 | 17.2 | 5.7 |
| Average Check | 131–176 UAH | 160–260 UAH | 534–816 UAH |
| LTV | 3,125 UAH | 4,476 UAH | 3,044 UAH |
| 12-Month Retention | 83.66% | 76.96% | 59.11% |
| Bonus ROI | 15.11x | 23.50x | 13.40x |
| Seasonality | Medium | Low | High (+128%) |
| Price Sensitivity | Low | Medium | High |
Optimal Cashback by Segment
One of the most common questions from businesses: “What cashback percentage should we set?”
| Segment | Optimal Percentage | Reason |
|---|---|---|
| Coffee Shops | 5–7% | Low average check and high frequency → a moderate cashback is sufficient |
| Cafés | up to 10% | Best ROI (23.5x) → higher cashback can be set without harming profit |
| Restaurants | 7–10% | Low visit frequency → a stronger incentive is needed |
HoReCa Demographics
Age Distribution:
- 18–25 years: 31.57%
- 26–35 years: 32.91%
- 36–45 years: 22.93%
- 46–60 years: 10.56%
- 61+ years: 2.02%
Customers under 35 are the core audience. Ages 18–35 account for 64.48% of users — nearly two-thirds of the entire audience. These are Millennials and Gen Z — people who grew up with smartphones and value digital-first approaches. They actively use loyalty programs if they are fast and simple.
Economic Impact of Loyalty Programs in 2025
1. Savings on communications: 12.24 million UAH
- Cost of 1 SMS: 1.29 UAH
- Push notifications: free (included in Loyallyst subscription)
- Notifications sent: 9,487,043
- SMS equivalent: 9,487,043 × 1.29 = 12,238,285.47 UAH
2. Time savings: 122,884 hours
- Automations executed: 2,457,688
- Business time savings: ~228 hours per year (~1 month of a marketer’s work!)
- Labor cost (at 300 UAH/hour): ~36.87 million UAH
3. Total savings: ~49.11 million UAH
Automation and push notifications pay off instantly. Businesses not only increase profits through customer retention but also save millions on operational costs.
AI Review Analysis:
28,095 reviews** analyzed by artificial intelligence in 2025
Overview:
- Positive: 69% (19,377 reviews)
- Negative: 3.1% (885 reviews)
- Ratio: 22:1 (for every 1 negative — 22 positive)
4 Most Common Reasons for Negative Feedback
1. Service/Staff — 42%
Nearly half of all negative feedback is related to staff: ignoring comments, rudeness, conflicts.
Since service quality is the main driver of negative reviews (~42%), investing in staff training is the fastest way to improve Retention.
2. Service Speed — 28%
3. Product Quality — 20%
4. Price — 10%
Only 10% of negative feedback is related to price. This indicates that consumers are rational and willing to accept a higher check. The main reason for dissatisfaction is “did not meet expectations,” not the cost itself.
Recommendation: Responding to negative reviews within the first 24 hours significantly reduces the likelihood of losing a customer. Guests whose concerns are addressed return much more often than those who are ignored.
4 Most Common Reasons for Positive Feedback
1. Taste and quality 2. Friendly staff 3. Atmosphere and interior 4. Service speed
Automation
2.5 million smart communications in 2025
Automation became the new norm in 2025. Businesses shifted from mass messaging to smart, trigger-based, and personalized communication.
2,457,688 automations were executed during the year.
Notification Distribution (9.5 million):
| Notification Type | Quantity | Percentage |
|---|---|---|
| News and updates | 3,126,967 | 33% |
| After transaction | 2,744,724 | 29% |
| Personalized offers | 2,098,594 | 22% |
| Review request | 1,011,169 | 11% |
| Before birthday | 132,488 | 1.4% |
| After registration | 90,627 | 1% |
| After last visit | 97,030 | 1% |
| About next loyalty tier | 43,265 | 0.5% |
Average notifications per customer: 19.2 notifications per year (~1.6 per month).
Conclusion: from mass messaging to smart trigger-based communication. Automation allows businesses to connect with customers at the right moment — without overwhelming them.
2025 Trends
1. Wallet Integration — the key trend of the year
Apple Wallet and Google Wallet are replacing mobile apps. This lowers the entry barrier for customers, as there is no need to download a separate app — the loyalty card is always available in the phone’s wallet.
2. AI-powered review analysis
28,000 reviews were analyzed using artificial intelligence. AI revealed that 42% of negative feedback is related to service and staff rather than product quality. This enables businesses to respond precisely to issues and improve customer experience.
3. Personalization instead of universal programs
Challenges perform better than static tiers. Unique mechanics (“20% on drinks only,” “whiskey years”) generate higher ROI than universal “5% on everything” offers.
What is gradually becoming obsolete:
- Plastic cards and standalone apps → Wallet
- SMS → Push notifications
- Mass campaigns → Personalized triggers
- Low cashback for everything (3–5%) → Higher, strategic cashback (7–10%)
Main trend: From “one program for everyone” to “a unique program for each customer.”
HoReCa Forecast for 2026
Expected visitation trends by segment:
| Segment | Visitation Forecast |
|---|---|
| Coffee Shops | +3%…+8% |
| Cafés | 0%…+5% |
| Restaurants | -5%…+2% |
The average check may increase by another +5–8% due to inflation and rising service costs, while visitation is expected to remain stable or grow slightly.
In 2026, all key trends from 2025 will continue gaining momentum. The strategic priority remains unchanged: customer retention is more cost-effective than acquisition. Therefore, next year it will be critically important to strengthen the focus on LTV (Customer Lifetime Value).


Frequently Asked Questions
According to the study, customers enrolled in a loyalty program have 3–5x higher LTV compared to those without one. On average, a loyalty member generates about UAH 3,877 over their lifetime, while a non-member generates UAH 900–1,500.
Coffee shops demonstrate the highest Retention — 83.66% over 12 months. Cafés show 76.96%, restaurants — 59.11%. Without a loyalty program, the average annual Retention in the industry is around 20%.
The optimal cashback depends on the segment: 5–7% for coffee shops, up to 10% for cafés, and 7–10% for restaurants. Higher cashback in restaurants helps offset lower visit frequency.
The critical window is the first 4 days after the initial visit. If a customer returns within the first week, the probability of long-term loyalty significantly increases. An automated message on day 5 substantially improves Retention.
The average ROI of loyalty programs is UAH 2.46 in revenue for every UAH 1 invested. Bonus ROI reaches 23.5× in cafés, 15.11× in coffee shops, and 13.40× in restaurants.
